Stop Getting Blindsided by Stock Dilution
SEC filings detected within 60 seconds of hitting EDGAR. 25 filing types summarized by AI and delivered to your inbox. All data is for informational research purposes only.
Only on DilutionWatchFTD Data·Short Squeeze Risk·Cash Runway·Warrant Overhang
How It Works
SEC filing → AI analysis → your inbox. In under 2 minutes, not hours.
Subscribe
Enter your email and the tickers you want to monitor. Start with our free data pages, or subscribe for custom watchlists.
We Scan 24/7
Our system scans SEC EDGAR every 60 seconds around the clock for new filings on your tickers.
AI Analysis
AI reads every filing, extracts share counts, offering terms, and flags dilution signals automatically.
Monitoring
Your Pulse™ feed tracks all activity — score changes, insider moves, institutional shifts — in real time.
Instant Alerts
Get email alerts with extracted details, risk analysis, and DilutionScore™ updates within minutes.
Stay Informed
Monitor ongoing SEC activity and filing patterns — all data is for informational purposes only. Investment decisions are yours to make based on your own research.
25 SEC Filing Types, Decoded
We don't just tell you "S-3 filed." We explain what it means and why it matters — so you can conduct your own informed research. Click any card to learn more.
Shelf Registrations
Form S-3, S-1, F-3 Filings
When a company files a shelf registration, they're loading the gun. It doesn't mean they'll fire immediately, but they now have permission to dilute at any moment for the next 3 years. We track size, terms, and likelihood of use.
Critical AlertProspectus Supplements
Form 424B, ATM Programs
This is the gun being fired. A 424B filing means shares are actively being sold into the market right now. ATM (At-The-Market) programs let companies drip-sell shares daily without announcement. We catch them all.
Cash RunwayFinancial Reports
Form 10-K, 10-Q Annual & Quarterly
The best predictor of dilution? Running out of money. We analyze quarterly and annual reports to calculate cash runway. When a company has 6 months of cash left, dilution is almost guaranteed.
Insider SignalsInsider Transactions
Form 4, Form 144 Filings
When the CEO is selling, you should know about it. Form 4 filings reveal insider buys and sells within 2 business days. We flag unusual patterns — like executives dumping shares before bad news drops.
InstitutionalOwnership Changes
Form 13D, 13G, 13F Filings
Track when hedge funds and institutions build or dump positions. A 13D filing means someone crossed 5% ownership with "activist" intentions. 13F shows quarterly holdings of major players like Vanguard and BlackRock.
Breaking NewsMaterial Events
Form 8-K Current Reports
The catch-all for anything important. CEO fired? 8-K. Bankruptcy warning? 8-K. Merger announced? 8-K. We parse these in real-time and flag the ones that signal dilution risk — like "entered into securities purchase agreement."
Transparent Pricing, Real Value
See exactly what you get at each tier — and why traders are switching from $60/month competitors.
Competitors $55–100/mo |
||||
|---|---|---|---|---|
| Core Monitoring | ||||
| Total SEC Coverage | ~2,500 pre-selected | 10,000+ all filers | 10,000+ all filers | 10,000+ all filers |
| Your Watchlist Slots | ✗ No choice | ✗ Browse only | 10 tickers | 30 tickers |
| Choose Your Own Tickers | ✗ | ✗ | ✓ | ✓ |
| SEC EDGAR Polling | 15-30 min delayed | ✗ | ✓ Every 60s | ✓ Every 60s |
| Filing Types Tracked | 8 types | ✗ | Critical only (S-3, 424B) | All 25 types |
| Alerts & Notifications | ||||
| Daily Digest Email | ✓ | Weekly only | ✓ | ✓ |
| Real-Time Email Alerts | ✓ | ✗ | ✓ | ✓ |
| Custom Alert Thresholds | ✗ | ✗ | ✓ | ✓ |
| Quiet Hours / DND | ✗ | ✗ | ✗ | ✓ |
| AI Intelligence | ||||
| DilutionScore™ Rating | ✗ | Top 10 only | Score only | ✓ Full breakdown + history |
| AI Filing Analysis | ✗ Manual only | ✗ | ✗ | ✓ Auto-parsed |
| Cash Runway Analysis | ✗ | ✗ | ✓ | ✓ |
| Warrant/Convertible Analysis | Basic | ✗ | ✗ | ✓ Advanced |
| Live Features | ||||
| Pulse™ Real-Time Feed | ✗ | ✗ | ✓ | ✓ |
| Alert History | 90 days | ✗ | 30 days | Unlimited |
| Market Intelligence | ||||
| 13F Institutional Holdings | Basic | ✗ | Summary view | ✓ Full data + charts |
| Short Interest Data | ✗ | ✗ | Summary | ✓ Full + history |
| FTD & Short Volume | ✗ | ✗ | ✗ | ✓ |
| Advanced Features | ||||
| Excel Export | ✗ | ✗ | ✗ | ✓ |
| Email Support | ✓ | Community | ✓ | ✓ Priority (24hr) |
| Browse Trackers | Subscribe Now | Subscribe Now | ||
Building something? Check out the DilutionWatch API — separate pricing for developers and quant traders starting at $79.95/mo.
Built for Traders Who Can't Afford Surprises
Every feature designed to give you the edge before dilution hits your portfolio.
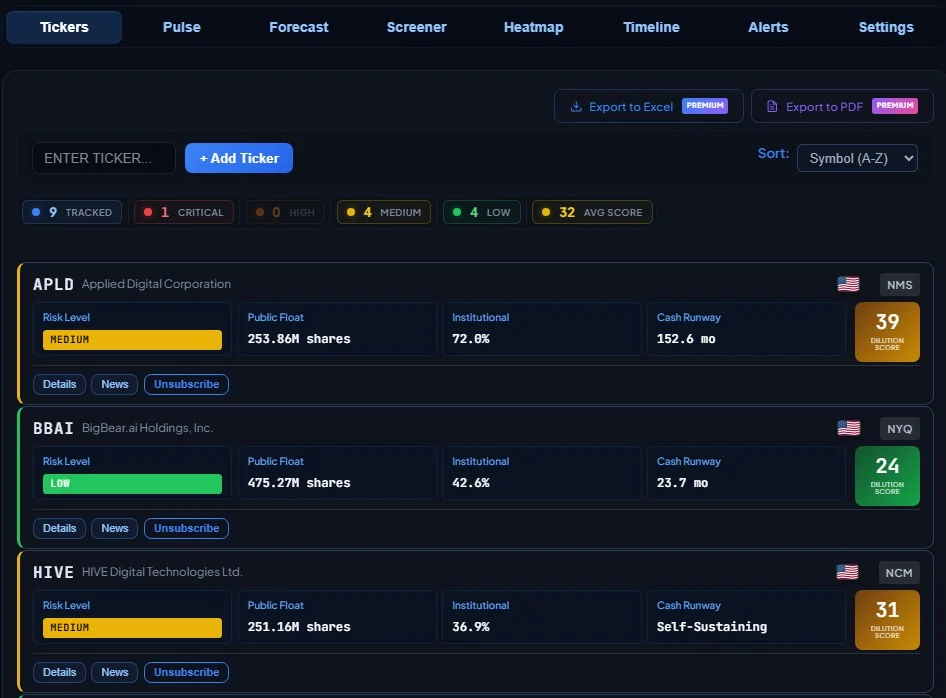
DilutionScore™
Proprietary Risk Algorithm
Our proprietary 0-100 scoring system analyzes five risk vectors: shelf registration capacity, cash runway, float risk, warrant overhang, and convertible exposure. Know your risk at a glance.
- ✓ Real-time score updates on new filings
- ✓ 5-component breakdown (Pro+)
- ✓ 3-year historical trend analysis
- ✓ Risk classification: Low → Critical
Pulse™ Feed
Live Activity Stream
A real-time feed of all dilution-related activity across your watchlist, prioritized by urgency. Critical events float to the top so you never miss what matters.
- ✓ Priority-weighted event stream
- ✓ Filter by ticker, filing type, severity
- ✓ Score change notifications
- ✓ Direct links to SEC filings
AI Intelligence
Automated Filing Analysis
Stop reading 200-page prospectuses. Our AI extracts the critical dilution data: share counts, offering terms, warrant details, and toxic deal red flags — delivered in seconds.
- ✓ Automatic Form 4 parsing
- ✓ 13D/13G ownership extraction
- ✓ Cash runway from 10-K/10-Q
- ✓ Toxic convertible detection
Data Lake
Institutional Intelligence
Aggregated market intelligence from 13F institutional holdings, FINRA short interest data, and fail-to-deliver reports — all in one dashboard for complete visibility.
- ✓ 13F holdings (Vanguard, BlackRock...)
- ✓ Short interest % and days-to-cover
- ✓ FTD tracking and trends
- ✓ Quarter-over-quarter changes
Frequently Asked Questions
What is stock dilution and why should I track it?
Stock dilution happens when a company issues new shares, reducing your ownership percentage. Events like shelf offerings, ATM programs, and warrant exercises can cause 20-50% price drops within days. Tracking gives you advance warning to protect your positions.
How quickly do alerts arrive after SEC filings?
We scan SEC EDGAR every 60 seconds around the clock. Subscribers receive alerts within 1-2 minutes of a filing appearing — often hours before financial news outlets report on it.
What makes DilutionWatch different from competitors?
We offer a free tier (competitors don't), AI-powered filing analysis (they use manual review), proprietary DilutionScore ratings, real-time 60-second scanning, and institutional data — all at lower prices ($19.95/mo vs $55-100/mo). Plus we cover 10,000+ tickers versus their 2,500.
Can I choose which tickers to monitor?
Yes! We cover 10,000+ SEC filers — every public company on EDGAR. Unlike competitors who limit you to their pre-selected list of 2,500 stocks, you choose exactly which tickers matter to you. Free accounts can browse our public data pages. Basic gets 10 custom watchlist slots, Premium gets 30.
Is there really a free tier?
Yes, free forever. Browse our Top 10 Diluters, Reverse Splits Tracker, and Shelf & ATM Monitor — no account needed. Want custom watchlists and real-time alerts? Plans start at $19.95/mo.
What SEC filings do you monitor?
We track 25 filing types: S-1/S-3 shelf registrations, 424B prospectuses, Form 4 insider transactions, 13D/13G ownership, 13F institutional holdings, 8-K material events, 10-K/10-Q financials, EFFECT notices, and more.
Turn dilution research into a watchlist workflow
Use DilutionWatch to monitor SEC filings, shelf registrations, ATM programs, warrants, reverse splits, and dilution-risk score changes for research purposes. Build a free watchlist, then upgrade when you need more coverage, history, alerts, or API access.
Educational research only. Not investment advice. Review source SEC filings before making decisions.
Ready to protect your portfolio?
Browse free data or subscribe from $19.95/mo. No credit card for free access.